Bitcoin most likely heading towards $83,000 over the next few months
Due to the lack of major financial drivers and Bitcoin’s failure to break above the upper resistance line around $126,000, the price is likely to move further downward before any meaningful upside. Avoid chasing short-lived pumps, as recent selloffs have been aggressive.
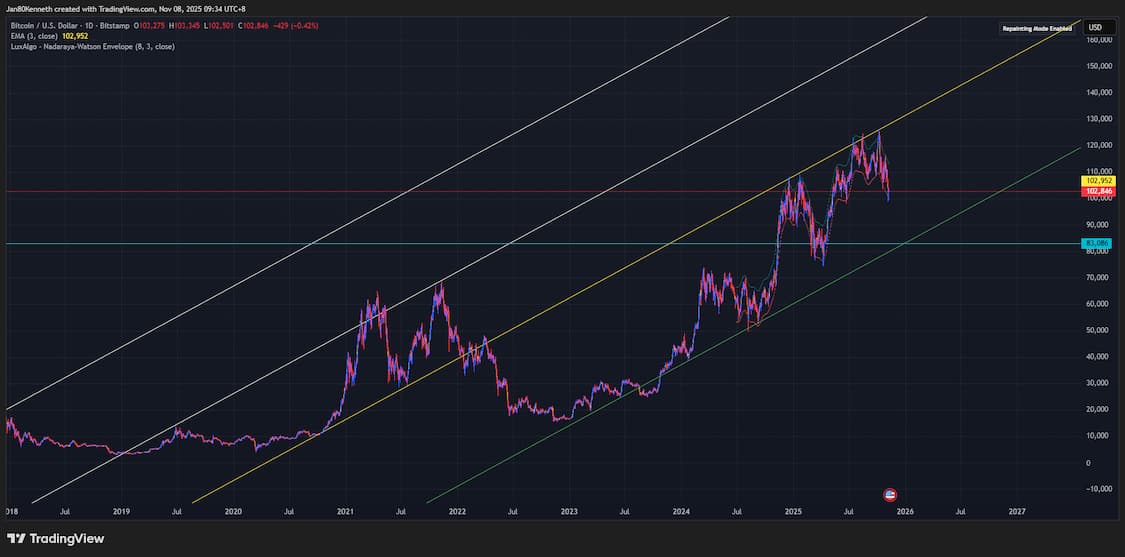
From my daily Bitcoin analysis above, we can clearly see that the price continues to respect the long-term trendline formed between 2020 and 2021, which now acts as upper resistance. A new trend appears to be developing from January 2024 through September 2024.
However, keep in mind that the lower green trendline is purely speculative. Several experts anticipate a much deeper correction, potentially toward $40,000. For now, it is important to remain cautious in the crypto market.
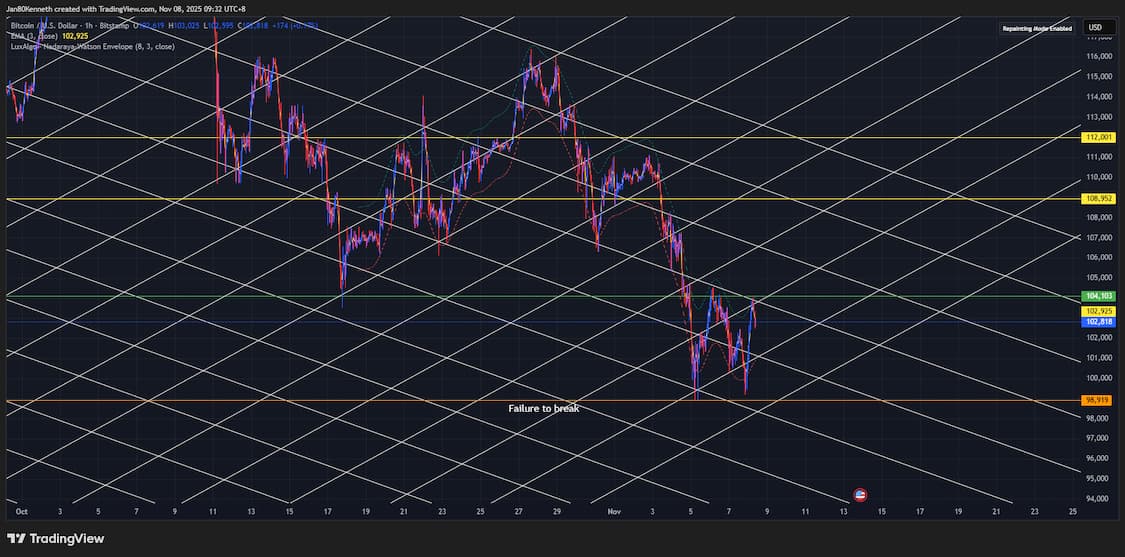
If Bitcoin breaks above $104,000 this weekend, we could see a move toward $108,000 and possibly $111,000. Failure to hold above $98,900 could suggest a pullback before further downside movement.